

05 Jan 5000 years history of Global Interest Rates
By all accounts 2019 was an incredulous year. Inverted yield curves and negative interest rates, nationalisation of tariffs, royal commissions, legislative interventions and credit tightening, out of cycle rate adjustments, global central bank interdependence, Australian debt markets and Federal elections.
To put it all into perspective for our generation, we have witnessed Australian rates fall to the lowest level in history. So, what a year it has been.
The graph below tells the real economic storyline. Anyone who has borrowed money over the past 30 years will have a personal narrative to tell of economic woe from the days of borrowing at 17.5% to our current economic malaise and misfortune driving rates down to the current 0.75%.
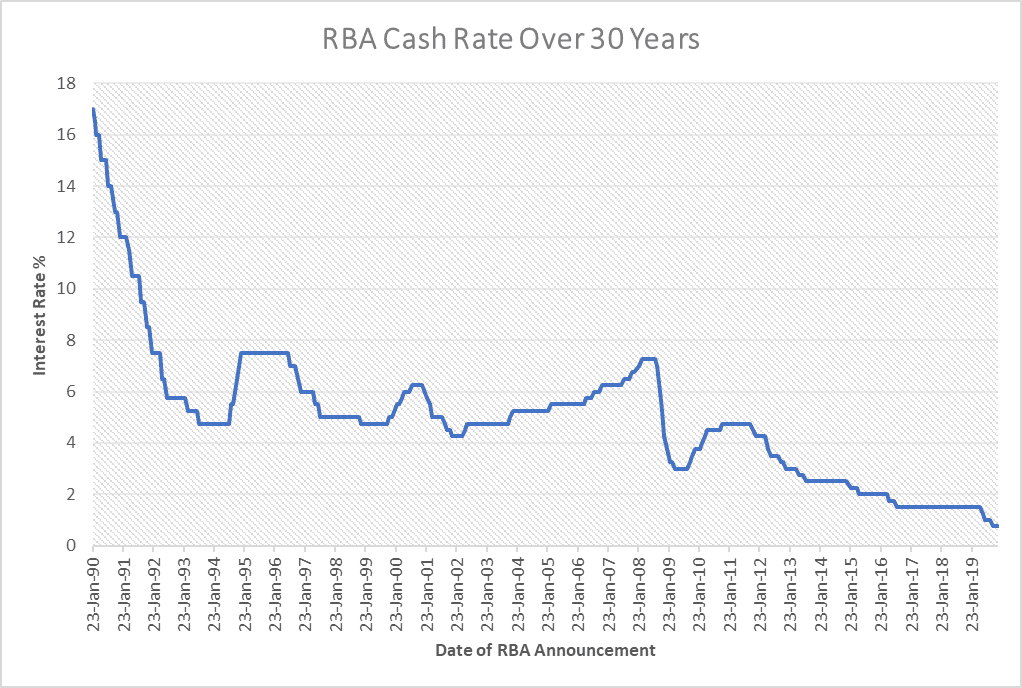
But how does this all benchmark against interest rates that spanned our civilised world over the millennia. On a comparative basis, rates remain at the lowest levels in the last 5,000 years of civilisation.

Photo courtesy of humanities.princeton.edu
Elena Holodny published an article in September 21, 2017 with specific reference to a speech made by Bank of England chief economist Andy Haldane and repeated again by Bank of American Merrill Lynch’s Michael Harnett depicting the chart below showing just how low today’s global rates are relative to those in the past.
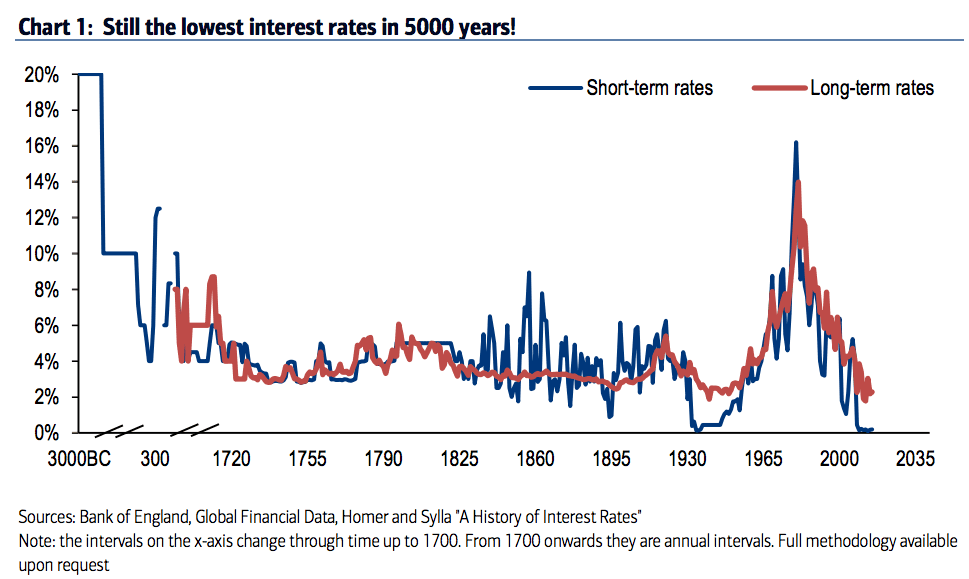
(For the academics in the room, the list of sources to compile this graph is noted at the end of this article.)
To make it a bit clearer, they had put together an annotated list of key historical episodes and the corresponding interest rate at the time;
- Mesopotamia, c 3000 BC: 20%
- Babylon, Code of Hammurabi, 1772 BC: codified earlier Sumerian custom of 20%.
- Persian conquest (King Cyrus takes Babylon), 539 BC: rates of 40+%.
- Greece, Temple at Delos, c. 500 BC: 10%
- Rome, Twelve Tables, 443 BC: 8.33%
- Athens/Rome: circa the first two Punic Wars, 300-200 BC: 8%
- Rome: 1 AD: 4%
- Rome, under Diocletian, 300 AD: 15% (estimated)
- Byzantine Empire, under Constantine, 325 AD: limit 12.5%
- Byzantine Empire, Code of Justinian, 528 AD: limit 8%
- Italian cities, c. 1150: 20%
- Venice, 1430s: 20%
- Venice, (Leonardo da Vinci paints “The Last Supper” in Milan), 1490s: 6.25%
- Holland, beginning of the Eighty Years’ War, 1570s: 8.13%
- England, 1700s: 9.92%
- US, West Florida annexed by the US, 1810s: 7.64%
- US, circa World War II, 1940s: 1.85%
- US, Reagan administration, 1980s: 15.84%
- US, Fed cut rates in October 2019 by 0.25%: 1.50-1.75%
- AUS, RBA drops rates by 0.25% on the 2nd October 2019 to 0.75%
In conclusion, rates during the BC era were by far the most disruptive by any means. Without a sequential thesis on the regulatory framework (or lack thereof) of this period, you could only imagine a world of finance being ruled under oppression and duress by the lords of their fiefdoms over their constituent borrowers.
It also highlights that our current “modern era” has been the second most disruptive epoch in history as the world has tried to adjust to rapid globalisation, technology, financial complexity, capital accumulation, flows and liquidity and cross border risk management (or lack thereof).
[Sources for Haldane’s account of historical rates: Homer and Sylla (1991), Heim and Mirowski (1987),Weiller and Mirowski (1990), Hills, Thomas and Dimsdale (2015 forthcoming), Bank of England, Historical Statistics of the United States Millenial Edition , Volume 3 and Federal Reserve Economic Database. Notes: the intervals on the x-axis change through time up to 1715. From 1715 onwards the intervals are every twenty years. Prior to the C18th the rates reflect the country with the lowest rate reported for each type of credit: 3000BC to 6th century BC – Babylonian empire; 6th century BC to 2nd century BC – Greece; 2nd century BC to 5th century AD – Roman Empire; 6th century BC to 10th century AD – Byzantium (legal limit); 12th century AD to 13th century AD – Netherlands ;13th century AD to 16th century AD – Italian states. From the C18th the interest rates are of an annual frequency and reflect those of the most dominant money market: 1694 to 1918 this is assumed to be the UK; from 1919-2015 this is assumed to be the US. Rates used are as follows: Short rates: 1694-1717- Bank
Sorry, the comment form is closed at this time.